Monitoring in AWS
Nowadays, to create a successful project we need a bit more than developed application. We should have CI/CD solution to deliver changes to upper environments. To prove that system still works, we can run set of e2e tests, but there’s one more thing, that we should set up in our system. And this missing thing is monitoring, which will help us to keep control over health and performance of an application. It may help keep optimal percentage of resources utilization in a cloud, that will lead to reduced costs.
There are plenty of different third party tools, but in this article I’ll show you how to set up simple monitoring in AWS cloud. Amazon Cloudwatch is monitoring service, that can gather logs and metrics from infrastructure resources or even on-premise applications. It allows you to create highly customized dashboards with different types of widgets, based on query logs, resource or custom metrics. Additionaly we can set up alarms based on metrics. So with dashboards feature we have single point of view over our application data, that can be spread across different AWS regions or even multiple accounts. I will show you how to create Cloudwatch dashboard, in a console first and then how to define it as a Cloudformation/SAM template.
Console setup
So let’s start console setup with terminal :)
sam init
I created Lambda written in Go with following code:
package main

import (
	"errors"
	"log"
	"net/http"

	"github.com/aws/aws-lambda-go/events"
	"github.com/aws/aws-lambda-go/lambda"
)

// handlers returns errors to generate logs on dashboard
func handler(request events.APIGatewayProxyRequest) (events.APIGatewayProxyResponse, error) {
	if value, ok := request.QueryStringParameters["error"]; ok {
		if value == "notfound" {
			log.Println("Error: not found")
			return createApiGatewayResponse("Not found\n", http.StatusNotFound)
		}
		log.Println("Error: internal server error")
		return createApiGatewayResponse("Error\n", http.StatusInternalServerError)
	}

	log.Println("operation successful")
	return createApiGatewayResponse("Success\n", http.StatusOK)
}

func createApiGatewayResponse(body string, statusCode int) (events.APIGatewayProxyResponse, error) {
	var err error

	if statusCode == http.StatusInternalServerError {
		err = errors.New("internal server error")
	}
	return events.APIGatewayProxyResponse{
		Body:       body,
		StatusCode: statusCode,
	}, err
}

func main() {
	lambda.Start(handler)
}
Let’s create Go binary running command form Makefile.
make build
And then simply deploy our example stack to AWS using SAM.
sam deploy \
--template-file ./template.yaml \
--stack-name cloudwatchDashboard \
--guided \
--capabilities CAPABILITY_IAM
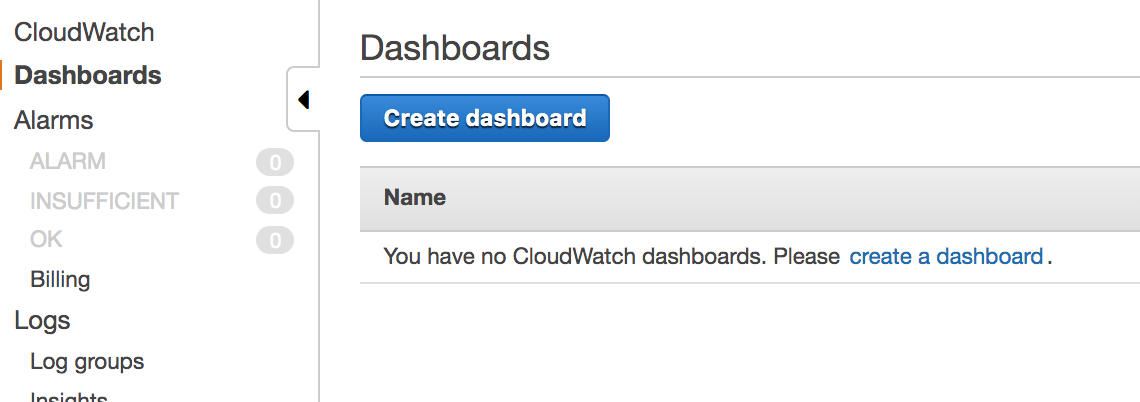
So let’s create empty dashboard in AWS console.
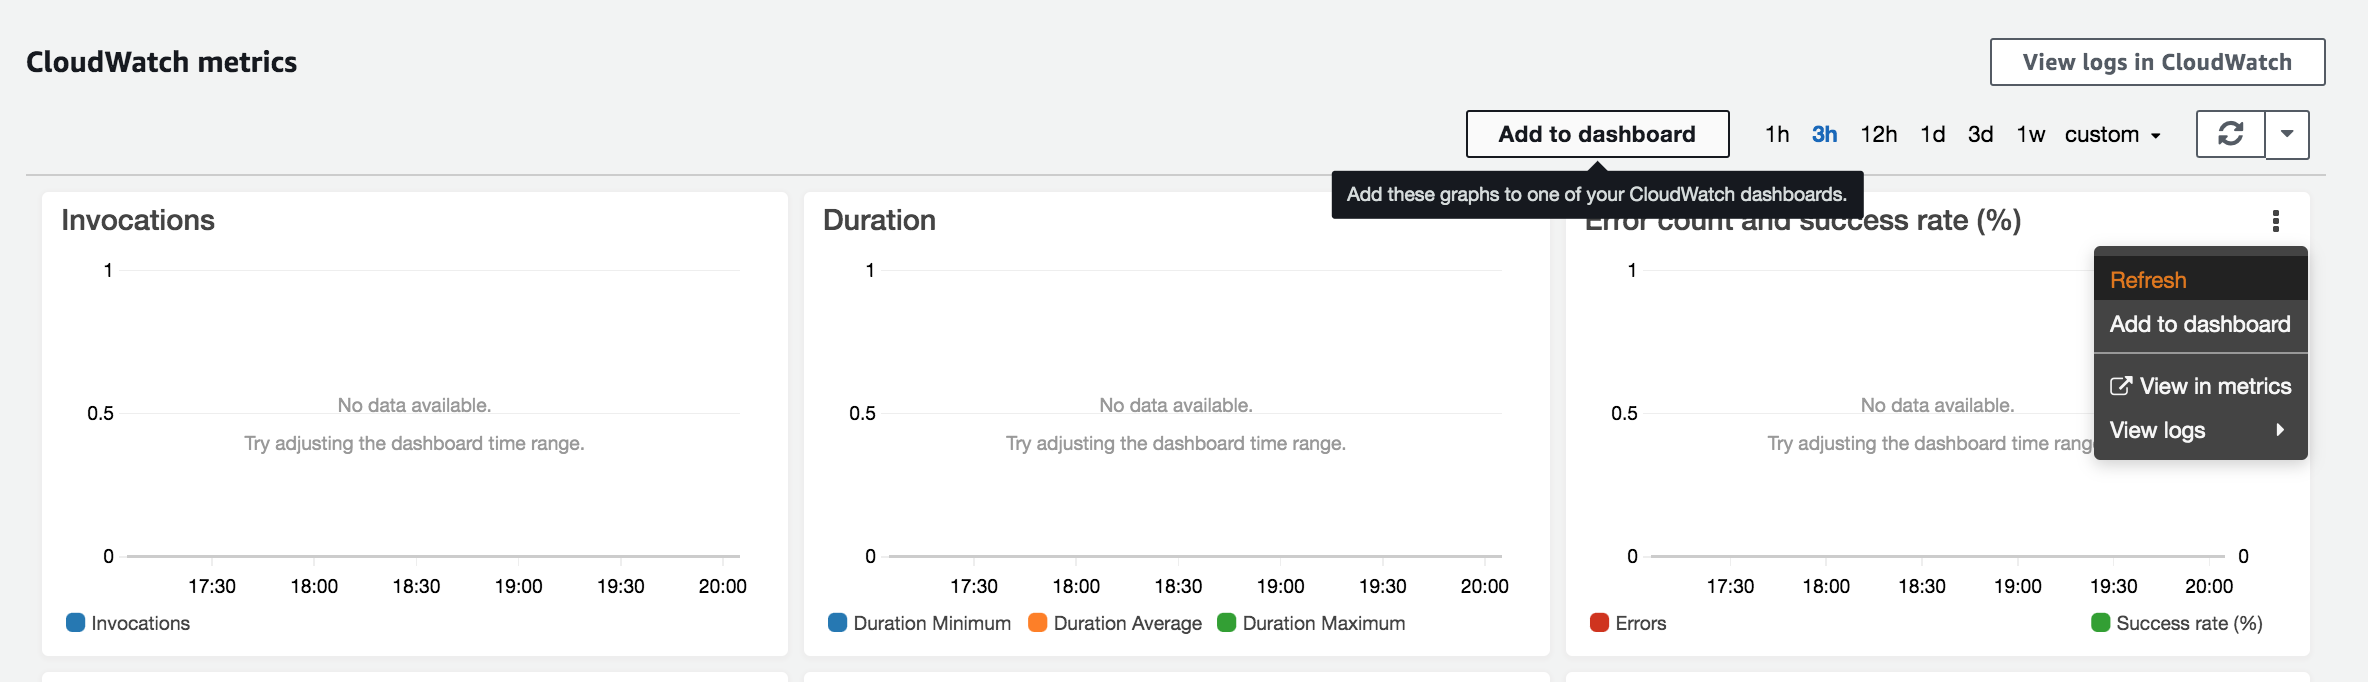
Now it’s time to add some widgets to dashboard. We can press Add widget button on dashboard screen, or… We can go to monitoring tab of our lambda, pick interesting widgets and then add it to our dashboard by clicking on widgets action’s button in top right corner of a widget. Or you could even add all widgets at once Add to Dashboard button!
I’ve added few standard lambda widgets. It’s pretty easy, but what if you need to show non standard data (eg. based on logs). Let’s go through it and add widget showing error logs
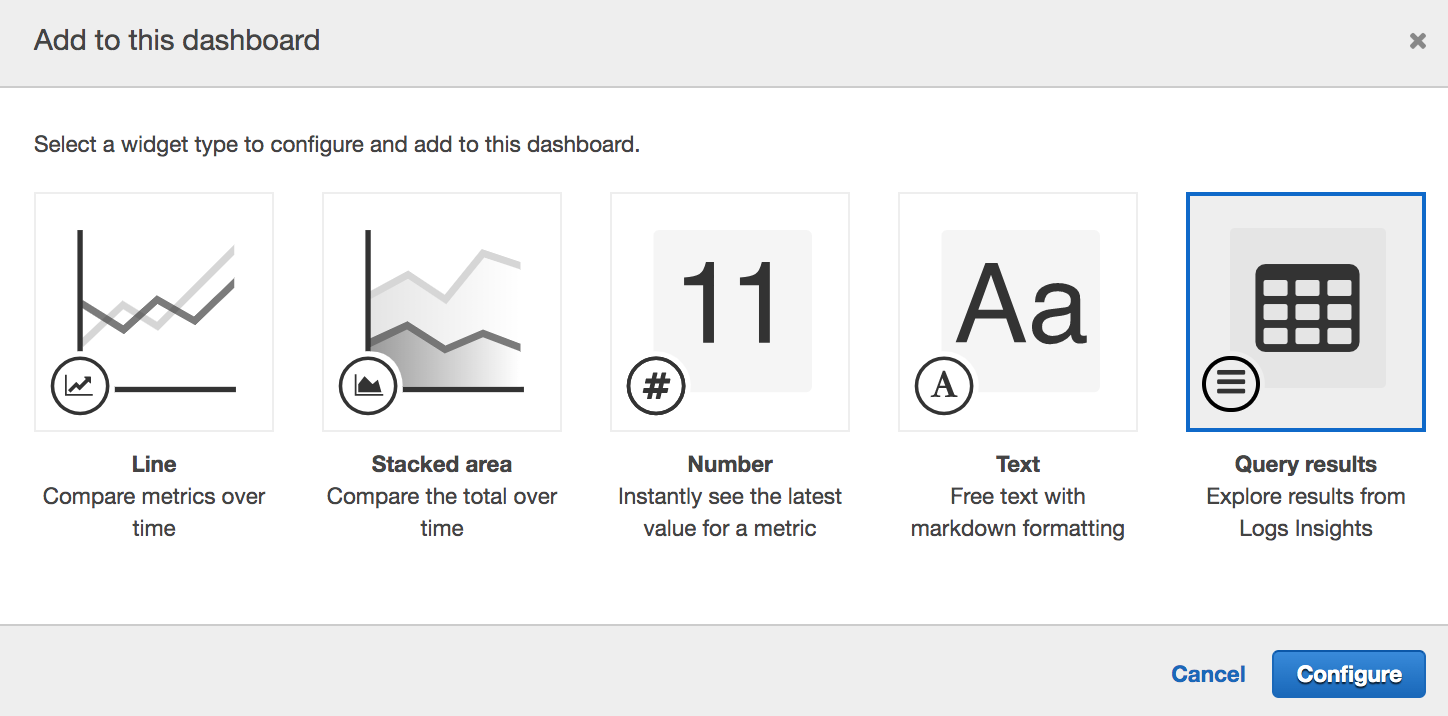
In a first step, let’s add log type widget to dashboard
Then we should modify CloudWatch Logs Insights query, to adjust it to our needs. In our case, we should display only logs, that contain some error. I will use following query:
fields @timestamp, @message
| sort @timestamp desc
| filter @message like /(?i)error/
And then just press Create widget
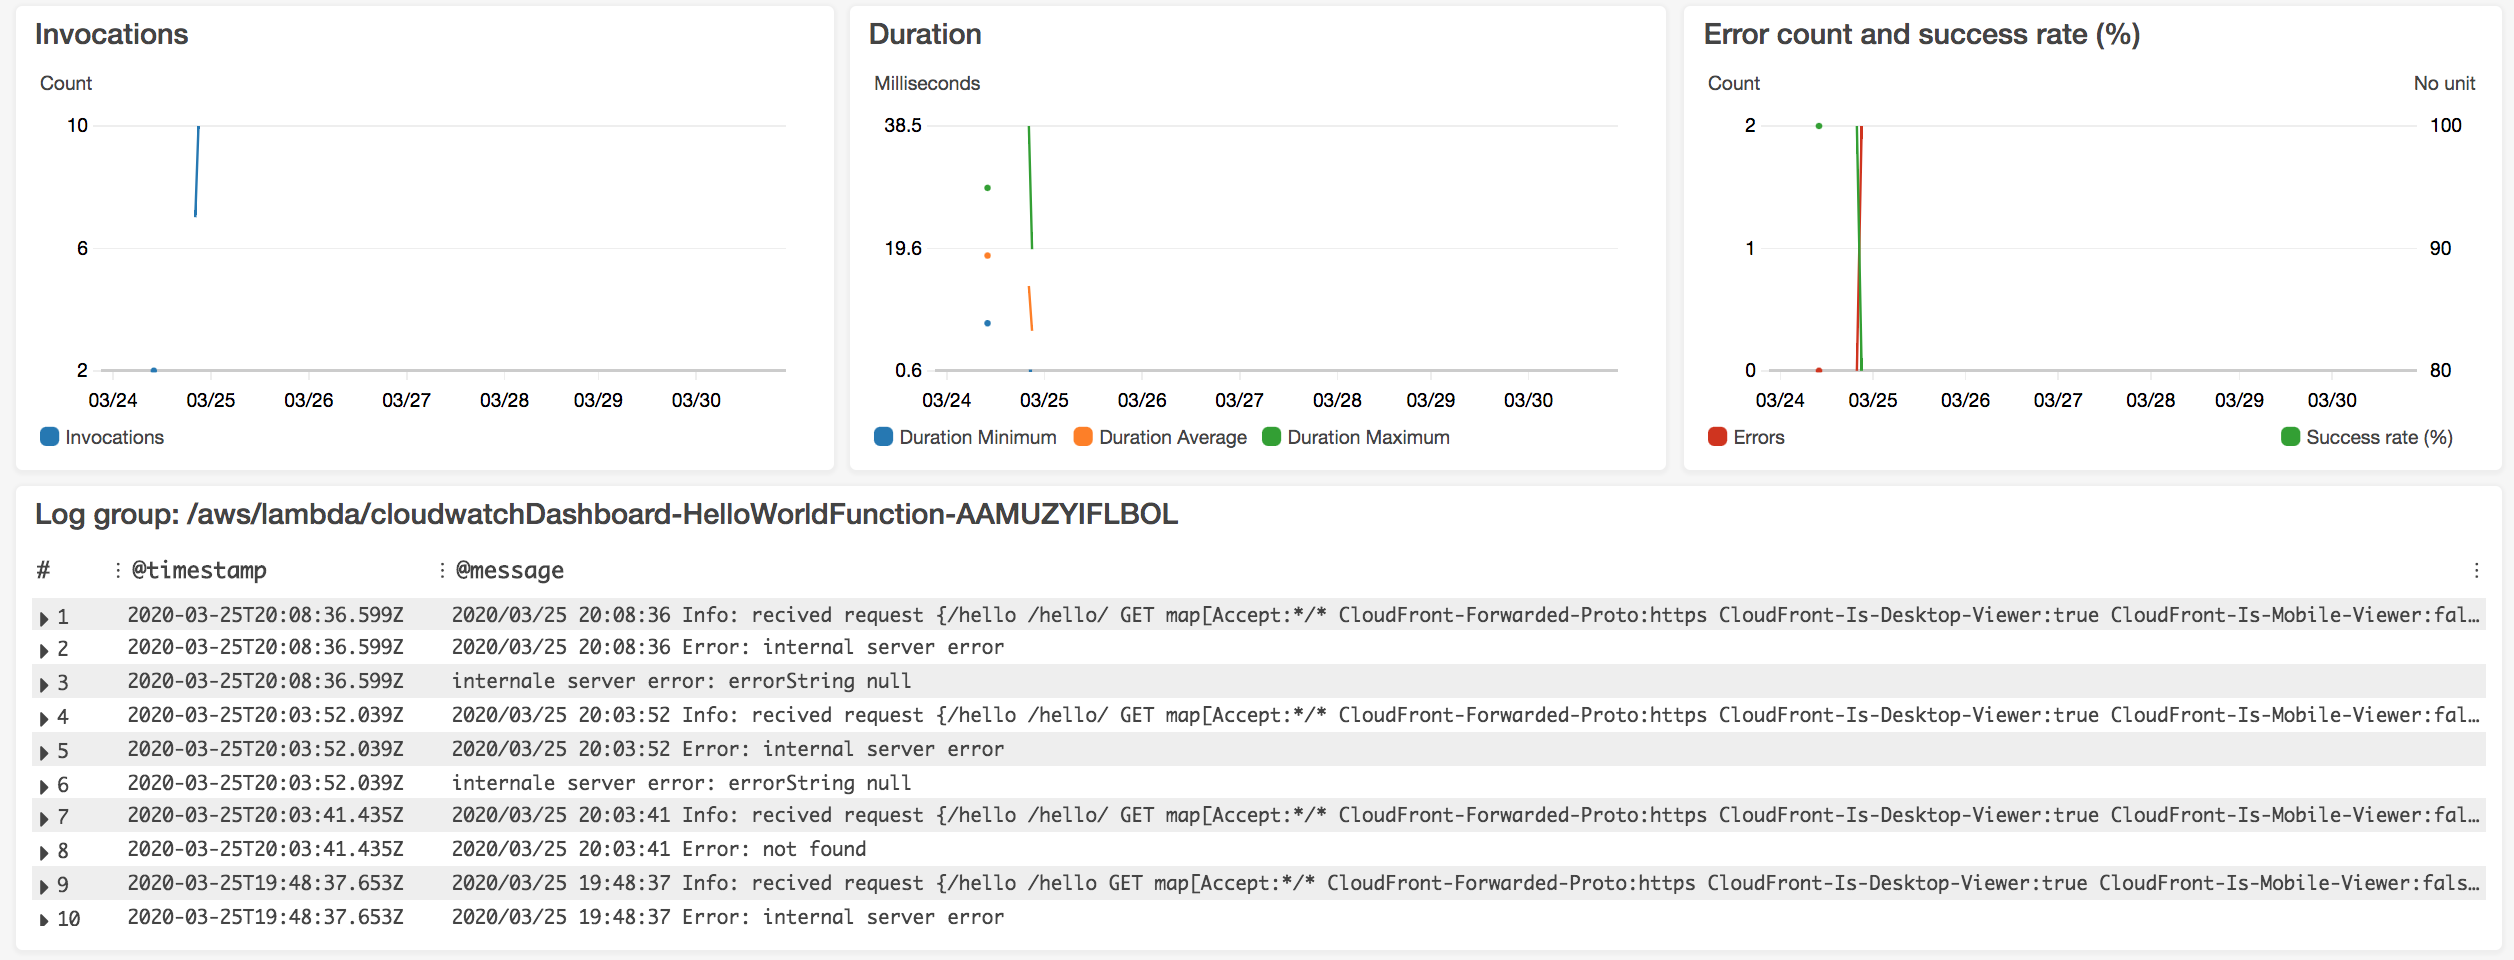
Here is final results
This simple dashboard was created really qucickly. But let’s imagin that you have few microservices and you want to display logs and metric in a single place. It would be painful to move this dashboard to upper environments using presented method. But maybe we could define dashboard following infrastrucure as a code apporach?
Moving to SAM template
When we have created dashboard it’s really easy to create Cloudformation/SAM scripts for it. So, let’s add to our SAM template following resource:
  MetricsDashboard:
    Type: AWS::CloudWatch::Dashboard
    Properties:
      DashboardName: 'SimpleDashboard'
			DashboardBody:
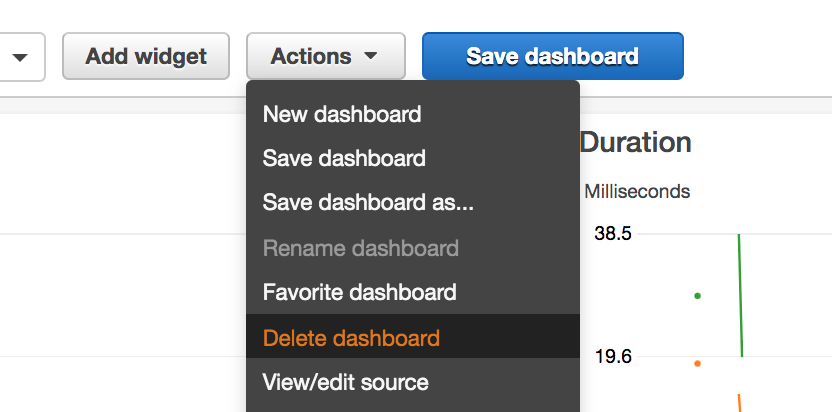
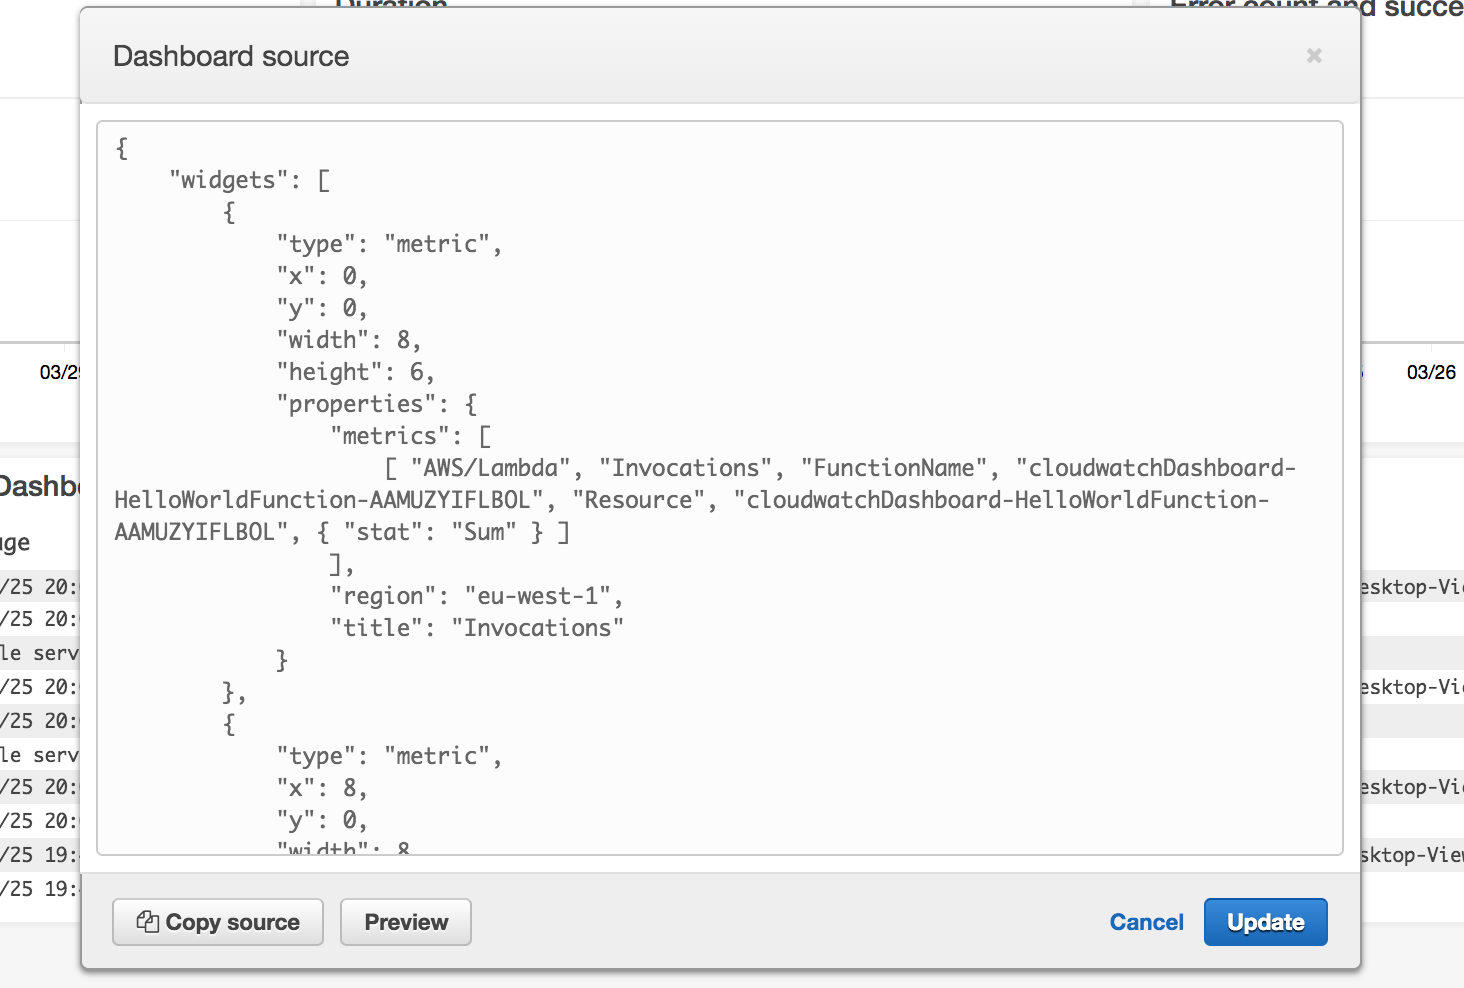
As you can see the missing part is value of DashboardBody property. To get it you need to go to console and on Actions list you need to click view/edit source:
And then simple copy json body of dashboard definition to DashboardBody property
I think that you should also replace hardcoded function names using !Sub function with lambda resource in all hardoced places. Here’s it’s final dashboard resource definition:
  MetricsDashboard:
    Type: AWS::CloudWatch::Dashboard
    Properties:
      DashboardName: 'SimpleDashboard'
      DashboardBody: !Sub |
        {
            "widgets": [
                {
                    "type": "metric",
                    "x": 0,
                    "y": 0,
                    "width": 8,
                    "height": 6,
                    "properties": {
                        "metrics": [
                            [ "AWS/Lambda", "Invocations", "FunctionName", "${HelloWorldFunction}", "Resource", "${HelloWorldFunction}", { "stat": "Sum" } ]
                        ],
                        "region": "eu-west-1",
                        "title": "Invocations"
                    }
                },
                {
                    "type": "metric",
                    "x": 8,
                    "y": 0,
                    "width": 8,
                    "height": 6,
                    "properties": {
                        "metrics": [
                            [ "AWS/Lambda", "Duration", "FunctionName", "${HelloWorldFunction}", "Resource", "${HelloWorldFunction}", { "stat": "Minimum" } ],
                            [ "...", { "stat": "Average" } ],
                            [ "...", { "stat": "Maximum" } ]
                        ],
                        "region": "eu-west-1"
                    }
                },
                {
                    "type": "metric",
                    "x": 16,
                    "y": 0,
                    "width": 8,
                    "height": 6,
                    "properties": {
                        "metrics": [
                            [ "AWS/Lambda", "Errors", "FunctionName", "${HelloWorldFunction}", "Resource", "${HelloWorldFunction}", { "id": "errors", "stat": "Sum", "color": "#d13212" } ],
                            [ ".", "Invocations", ".", ".", ".", ".", { "id": "invocations", "stat": "Sum", "visible": false } ],
                            [ { "expression": "100 - 100 * errors / MAX([errors, invocations])", "label": "Success rate (%)", "id": "availability", "yAxis": "right" } ]
                        ],
                        "region": "eu-west-1",
                        "title": "Error count and success rate (%)",
                        "yAxis": {
                            "right": {
                                "max": 100
                            }
                        }
                    }
                },
                {
                    "type": "log",
                    "x": 0,
                    "y": 6,
                    "width": 24,
                    "height": 6,
                    "properties": {
                        "query": "SOURCE '/aws/lambda/${HelloWorldFunction}' | fields @timestamp, @message\n| sort @timestamp desc\n| filter @message like /(?i)error/",
                        "region": "eu-west-1",
                        "stacked": false,
                        "view": "table"
                    }
                }
            ]
				}
Here you can find this example and play with it :)